Getting Started
[1]:
from muler.igrins import IGRINSSpectrum
from specutils import Spectrum1D
import numpy as np
import matplotlib.pyplot as plt
%matplotlib inline
%config InlineBackend.figure_format='retina'
Simply tell the IGRINS Spectrum where your file is located.
[2]:
path = 'https://github.com/OttoStruve/muler_example_data/raw/main/IGRINS/01_IGRINS_test_data/'
filename = 'SDCH_20201202_0059.spec_a0v.fits'
spec = IGRINSSpectrum(file=path+filename)
The object is an instance of a specutils Spectrum1D class.
[3]:
type(spec), isinstance(spec, Spectrum1D), isinstance(spec.flux, np.ndarray)
[3]:
(muler.igrins.IGRINSSpectrum, True, True)
You can normalize the spectrum easily:
[4]:
%%capture
spec = spec.normalize()
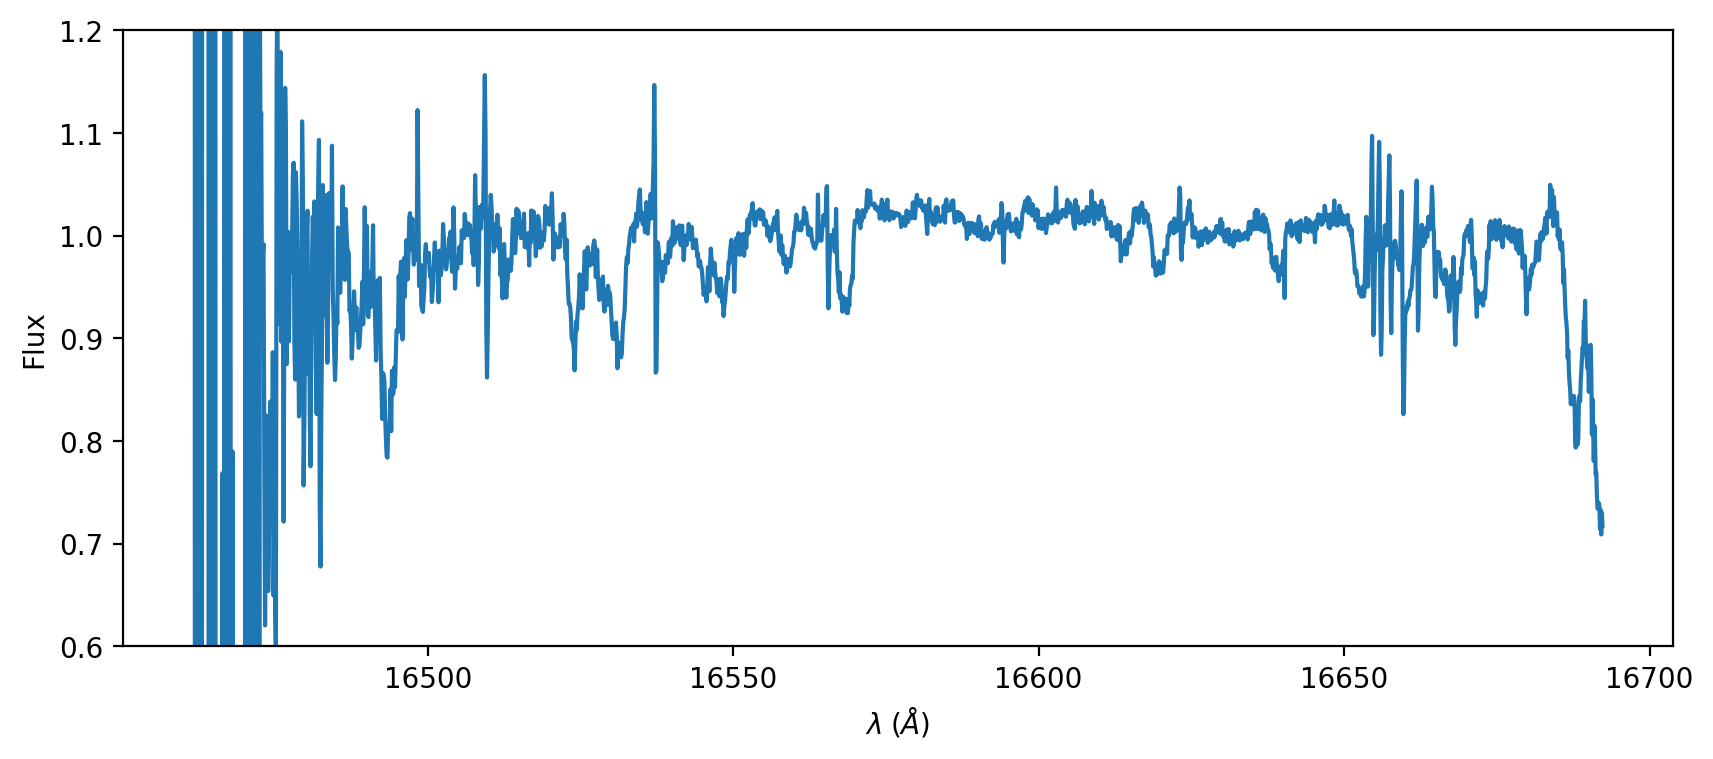
Finally, we can plot the spectrum:
[5]:
plt.figure(figsize=(10, 4))
plt.plot(spec.wavelength, spec.flux)
plt.ylim(0.6, 1.2)
plt.xlabel('$\lambda \;(\AA)$'); plt.ylabel('Flux');

We see the spectrum with genuine astrophysical signals, instrumental artifacts, and noise.